My niece is seventeen. She was scrolling Instagram at my place last weekend and stopped on a new launch ad. Two bedder, $2.3 million.
She turned to me and asked the only question that actually matters.
“Why is it SO expensive ah.”
I could have said interest rates. Foreign demand. Construction costs. “The market lah.”
All true. All boring. All missing the real answer.
Because the real answer starts about three years before that showflat ever opens, with a number almost nobody bothers to explain properly. It’s the price the developer paid for the land.
Once you understand how that number turns into your purchase price, you can estimate a launch price yourself, before the developer confirms anything.
It works just like COE
Every few months, the government auctions a piece of land for developers to bid on. It’s called a GLS tender, Government Land Sales.
Think of it like COE. The bids are public. The winning number gets published the next day. And everyone in the industry reads it as a confidence signal, the same way a high COE premium tells you people are feeling good about buying cars.
There’s one term you need, and only one: psf ppr. Price per square foot per plot ratio.
Think of a cake. Plot ratio is how many layers you’re allowed to stack. So psf ppr lets you compare a tall skinny plot against a short fat one fairly, cake to cake, instead of just staring at total price tags that tell you nothing.
That’s the number that ends up, almost mathematically, inside your future home.
Yes, it’s really climbing
Two suburban land records, five years apart.
July 2021, a Lentor Central site hit $1,204 psf ppr. A record for suburban land at the time. September 2026, New Upper Changi Road broke it at $1,537 psf ppr.
Same tier of land. Five years. The ceiling moved up nearly 28%.
That’s not a headline writer’s opinion. That’s two government tenders, both setting records for the same kind of land.
From land price to your price
A land rate on its own tells you nothing until you know what it becomes. So here’s one clean example.
In July 2021, GuocoLand won that Lentor Central site at $1,204 psf ppr. It became Lentor Modern. It sold out fully, at an average of $2,107 psf.
That’s a 75% markup over the land price.
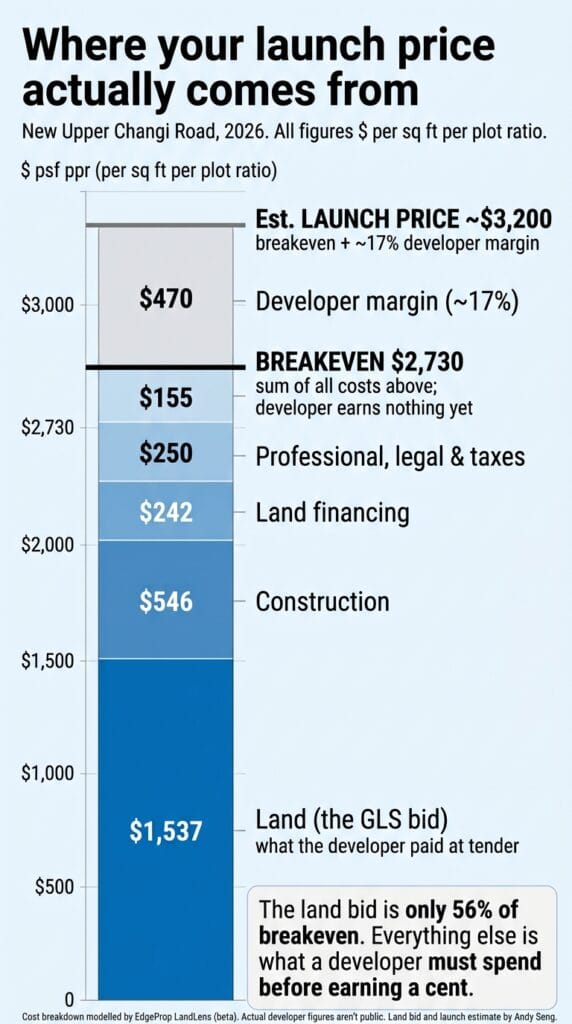
Looks like pure profit. It isn’t. Most of that gap is the developer covering construction, financing, taxes, and marketing before they see a single dollar for themselves. I’ll pull that gap apart properly further down, with real cost data.
The part nobody explains: the developer’s clock
Here’s what most buyers never hear.
When a developer buys land, they pay a tax called ABSD. Right now it’s 40% of the land price. 5% of that is gone no matter what happens.
The other 35% only comes back if they sell at least 90% of the units within 5 years. Miss that deadline, and the government claws the money back, plus 5% interest for every year.
That threshold used to be 100%. It was eased to 90% in 2024. So developers today have a little more breathing room than a few years ago, but not much.
Now here’s my read, not confirmed fact. That clock is the real reason developers price hard and market aggressively from day one. It isn’t greed. It’s a countdown with a real penalty attached.
And notice something in the news next time a big site sells. It’s often two or three developers bidding together as a joint venture. That’s not weakness. That’s a group of friends pooling money for one very expensive COE bid, because nobody wants to carry that whole risk alone.
So ask yourself the honest question. If the biggest, most exposed players in the entire market, the ones facing a 5-year tax deadline, are still bidding hard for land, what does that tell the ordinary buyer on the street?
Reading the tender like an order book
If you’ve ever looked at a trading screen, you’ll know an order book. It shows who’s bidding, at what price, and how many.
A GLS tender isn’t literally an order book. It’s a sealed, one-shot auction, not a live one. But it gives you the same signal. Who showed up, and how close together they bid.
The Lentor Hills estate is the cleanest example I can give you, because five separate sites got tendered there within about two years. Same estate. Same MRT line. Same buyer pool. Apples to apples, not apples to durian.
| Tender closed | Bids | Land rate (psf ppr) | Became | Launch price (psf) | Take-up |
|---|---|---|---|---|---|
| Jul 2021 | 9 | $1,204 | Lentor Modern | $2,107 | 84% opening weekend |
| Jan 2022 | 4 | $1,060 | Lentor Hills Residences | $2,099 | 99% |
| Sep 2022 | 3 | $1,108 | Hillock Green | $2,108 | 27.6% day one, 87% total |
| Apr 2023 | 1 | $985 | Lentor Mansion | from $2,082 | 75% in 2 days |
| Sep 2023 | 2 | $982 | Lentor Central Residences | $2,200 | 93% opening weekend |
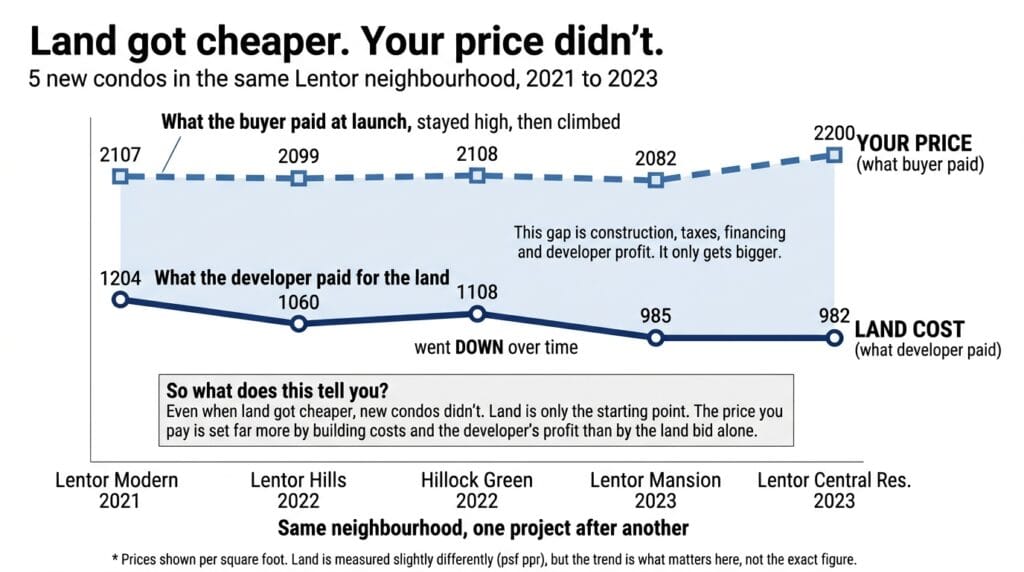
Look at the land rate. It actually falls across those five tenders. Developers paid less for the ground with almost every site.
Now look at the launch prices. They hold, then climb.
And every single project sold strongly, whether nine developers turned up to bid, or just one.
That’s the honest, slightly inconvenient part. Bid count tells you how developers felt about the land, in that market, at that moment. It does not reliably predict how buyers will feel about the finished home a year or two later.
Lentor Gardens drew just one bid in 2023. That looks like fear. It wasn’t. PropNex’s research head pointed out that a technical change in how floor area gets counted had just eaten into how much a developer could actually sell, which made the site look worse on paper for reasons that had nothing to do with buyer demand. That site became Lentor Mansion. It sold 75% of its units in two days.
So treat bid count as a read on developer appetite for the dirt. Not a forecast of your future neighbours’ enthusiasm.
And notice the bigger thing sitting under all five rows. Land got cheaper, yet launch prices and margins kept climbing anyway. Land is only part of the story. Construction cost inflation and plain pricing power explain the rest.
When the winner pays too much
Being right about the trend doesn’t mean every bid is right.
There’s a thing in auction theory called the winner’s curse. In a competitive bid, the winner is often just the one who most overestimated the value. Not the one who saw something everybody else missed. Sometimes they simply got carried away.
Cuscaden Reserve is the textbook case. Its 2018 land bid set a then-record $2,377 psf ppr. When it launched in September 2019, units reached as high as $3,830 psf. At that address, it should have sold itself.
Instead, only 12 units moved in four years.
In March 2024, the developer relaunched from $2,850 psf. That’s roughly 20% below what earlier buyers had paid, and below EdgeProp’s own estimated breakeven of $3,204 psf ppr for the site.
Whatever the internal maths, that is a developer resetting price hard, years after a record bid. Like a designer bag quietly marked down once the season’s hype cools.
High conviction can be right, like Lentor Modern. It can also be a warning sign wearing a confident face, like Cuscaden. You won’t know which for years.
Now do it yourself
Next time a GLS site makes the news, here’s the maths in three steps.
One. Find the reported land rate, in psf ppr.
Two. Multiply it. For a suburban site, use around 1.7 to 1.8. For a prime central site, where land is the biggest cost, use a lower 1.4 to 1.5. That gives you a rough breakeven, what the developer needs just to cover everything before profit.
Three. Developers aren’t a charity. They answer to shareholders and they pay staff. So add a modest 15% to 20% on top of that breakeven. That’s your estimated launch price.
Quick example, using a suburban site at $1,300 psf ppr. Breakeven works out around $2,210 to $2,340 psf. Add the margin, and you’re looking at roughly $2,540 to $2,810 psf at launch.
One honest caveat before you run with it. This is a back-of-envelope range built from real completed projects, not a valuation. Actual prices also move with construction costs, unit mix, how long the developer waits to launch, and where the market goes in between. Use it to sanity-check a number. Not to sign anything.
Testing the formula on real sites
I didn’t want to just hand you a rule of thumb and hope. So I checked it against EdgeProp’s own cost model for eight real sites.
Eight sites is a pattern worth knowing. It isn’t a lab result. Treat every number below as a rough range.
| Site, then project | Land rate | Est. breakeven | Breakeven vs land | Actual launch | Margin over breakeven |
|---|---|---|---|---|---|
| Cuscaden Road, Cuscaden Reserve | $2,377 | $3,204 | 1.4x | $3,625 (avg) | +13% |
| Bernam St, One Bernam | $1,463 | $2,264 | 1.5x | $2,650 | +17% |
| Tan Quee Lan St (Bugis), Midtown Modern | $1,535 | $2,356 | 1.5x | $2,825 | +20% |
| Lentor Hills Rd, Lentor Hills Residences | $1,060 | $1,820 | 1.7x | $2,099 | +15% |
| Lentor Central, Hillock Green | $1,108 | $1,963 | 1.8x | $2,108 | +7% |
| Lentor Gardens, Lentor Mansion | $985 | $1,797 | 1.8x | $2,082 | +16% |
| Lentor Central, Lentor Central Residences | $982 | $1,793 | 1.8x | $2,200 | +23% |
| New Upper Changi Rd, not launched yet | $1,537 | $2,730 | 1.8x | est. $3,100 to $3,300 | est. +15 to 20% |
Two clear patterns.
Prime, central sites carry a lower breakeven multiple, around 1.4 to 1.5 times the land rate. That’s because land is such a huge chunk of total cost there that construction barely moves the needle. Suburban Lentor sites run higher, around 1.7 to 1.8 times, because land is cheaper so everything else eats a bigger share.
But the margin over breakeven holds fairly steady everywhere. Somewhere between +7% and +23%, averaging around +16%.
That last row is the formula in action, not a market call. New Upper Changi Road hasn’t priced a single unit yet. The real number will depend on decisions the developer hasn’t made. But you now have a defensible ballpark before they say a word.
What this actually means for you
Three questions to ask, the next time a land bid makes the news.
Is this bid anywhere near me? A record price in the prime central region changes nothing about your suburban budget. Match the location, not the headline.
Was it a crowd, or a one-off? Nine developers bidding within a few percent of each other is genuine consensus. One lonely bid might just be a technical quirk, so check before you either panic or FOMO in.
How much room does the developer actually have? Ignore the raw markup over land, because prime sites always show a smaller one than suburban sites for the same profit. What matters is the margin over breakeven. Thin margin means thin room to discount if buyers go quiet. That’s when patient buyers get their opening.
The bottom line
The land bid isn’t a boring number buried in a URA press release. It’s the first domino.
Run it through the formula and you’ll have a realistic launch price before the developer confirms anything. And from the bid count alone, you’ll get a read on how confident the most exposed players in the whole market really are.
So next time a GLS tender makes the news, don’t scroll past it. Do the maths.
That number is your future launch price. It’s just wearing a disguise.
Eyeing a launch that hasn’t opened yet, and want a straight read on whether the land price actually supports the asking price? Message me the site and I’ll walk through the numbers with you. No spin either way.
Sources: URA tender results via EdgeProp; GuocoLand press releases on Lentor Modern, Midtown Modern and Lentor Central Residences; EdgeProp reporting on One Bernam, Hillock Green, Lentor Mansion, Lentor Hills Residences and Cuscaden Reserve; IRAS and Rajah & Tann on ABSD developer remission; EdgeProp LandLens / Buddy breakeven estimates (modelled figures, in beta). Full links available on request.